Create a dot plot chart in Excel quickly and easily
Kutools for Excel
Boosts Excel With 300+
Powerful Features
In Excel, the dot plot also named as dot chart is used to show the frequency of different pieces of data in a set. In this chart, the data points are plotted as dots which are placed across different categories. To create this type of chart, Kutools for Excel’s Dot Chart can help you to insert this chart quickly and easily.
Create a dot plot in Excel with several clicks
Format the dot plot such as change dot type, add data labels, etc.
Create a dot plot in Excel with several clicks
After installing Kutools for Excel, please apply the following steps to create a dot chart:
1. Click Kutools > Chart > Category Comparison > Dot Chat, see screenshot:

2. In the popped out Dot Chart dialog box, please select the axis labels and series values from your data table, see screenshot:

3. Then, click Ok button, the dot plot has been created successfully, see screenshot:

Format the dot plot such as change dot type, add data labels, etc.
After creating the dot chart, if you want to change the dot type, dot size or other settings, please do as this:
Change the dot type or size of the dot chart:
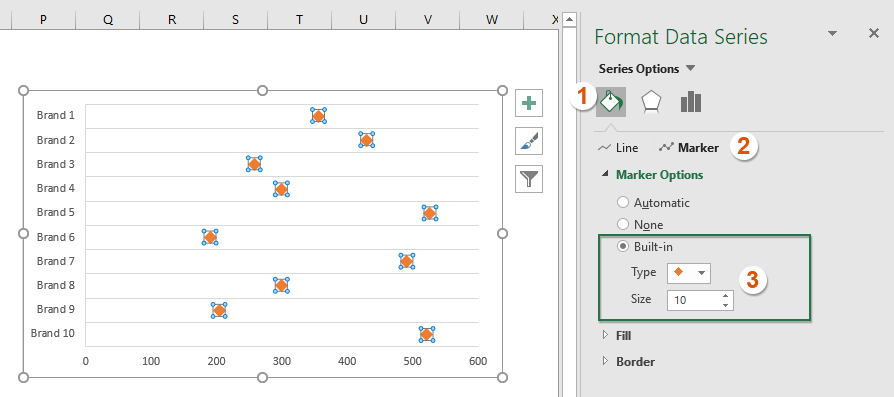
1. Right click any one data dot, then choose Format Data Series option, see screenshot:

2. In the opened Format Data Series pane, click Fill & line tab, and then click Marker option, under the Marker Options section, specify the marker type and size to your need, see screenshot:
Change the dot color of the dot chart:
Still in the Fill & Line tab in the Format Data Series pane, under the Marker section:
- Select Solid fill from the Fill section, and choose one color you need from the Color drop down list;
- Select Solid fill from the Border section, and choose the same color as the fill color you specified from the Color drop down list.

Add data labels to the data series:
If you need to add the data labels for the chart, please do with the following steps:
1. Click any one data dot to select all of them, and then click Chart Elements to expand the list box, and then check Data Labels option, see screenshot:

2. Then right click one of the data labels, and choose Format Data Labels from the context menu, see screenshot:
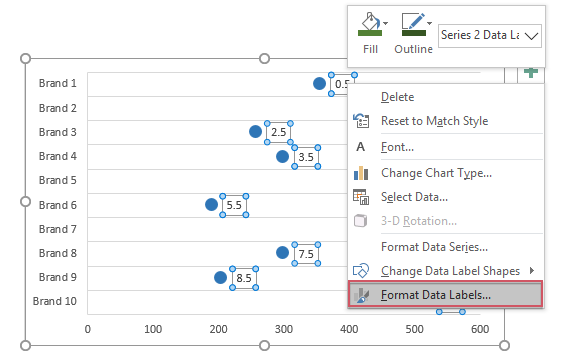
3. In the Format Data Labels pane, under the Label Options tab, uncheck the Y Value, and then check the X Value option, and data labels have been inserted as below screenshot shown:

Note: For the first time you apply the Dot Chart feature, you can click the Example button in Dot Chart dialog box to open a new workbook with the sample data and sample Dot Chart to know how it works.
Productivity Tools Recommended
Office Tab: Use handy tabs in Microsoft Office, just like Chrome, Firefox, and the new Edge browser. Easily switch between documents with tabs — no more cluttered windows. Know more...
Kutools for Outlook: Kutools for Outlook offers 100+ powerful features for Microsoft Outlook 2010–2024 (and later versions), as well as Microsoft 365, helping you simplify email management and boost productivity. Know more...
Kutools for Excel
Kutools for Excel offers 300+ advanced features to streamline your work in Excel 2010 – 2024 and Microsoft 365. The feature above is just one of many time-saving tools included.
